
The model has three parts:
1. Team strength metric. To measure this we use two metrics: your recent results (measured with a Elo ranking) and the quality of its players (measured with their value in euros, with data from the website Transfermarkt).
2. Match simulator. We have trained a model with thousands of matches to, given two teams and their strength metrics, estimate how likely each outcome is. The model tells the probability of victory, draw and defeat; even that of each marker. For example, in a hypothetical duel between Argentina and Bolivia, the most probable results are 2-0 and 3-0 with 14% each.
3. Complete Copa América simulator. Finally, what we do is simulate the tournament match by match. We repeat this thousands of times, to have 200,000 possible tournaments, and thus be able to estimate the probability of each event.
Below we answer some common questions with the model. Then, we give more details of its operation.
So, you say Argentina is going to win? No no. Our model says that Argentina is the most likely team, but also that it has only one option in three to win. It is important to interpret this correctly: in reality, his victory is just as likely as seeing Manu Ginobili make a three-pointer.
These data show that a Copa América is difficult to predict. And it’s not a surprise. First, it is a tournament designed to be influenced by luck: it is not a regular league, it has no playoffs, nor round-trip matches. Second, national teams play few important games and their performance is more uncertain than that of a club. And third, we talk about football, an exciting sport because it is full of surprises. Almost no one would sit down to watch a game if the result was decided.
Have you done this before? Yes. We used a similar model in the 2018 and 2022 World Cups. Here you can read how each worked. The model has proven to be well calibrated: outcomes to which we gave a probability between 0% and 15% occurred 4% of the time, for example, and those with a probability of 85% or 100% occurred 94% of the time. In 2018, we did much better than chance, better than the FIFA ranking and two big banks (UBS and Goldman Sachs), although France won, which was only our sixth favorite to begin with. In 2022, the final was played by two of the three teams that we saw as the best, and we even beat the bets.
Should I bet using your predictions? No. Our model is relatively sophisticated and can work well. But betting has proven in the past to be very difficult to improve. Furthermore, in order not to lose money, it is not enough to beat them; you must also compensate for the margin that bookmakers reserve when setting prices.
Statistical models are useful as a reference, for transparency and because they allow us to calculate details that the bets do not respond to. But, when it comes to getting it right, the bets use a hybrid approach: they combine their own models with the fine adjustment made by their experts, to consider the extra information they have (such as details of playing styles, states of form or injuries).
What is a ranking Elo. It is a metric that captures the strength of each team based on its results. Each team has a certain amount of points—their Elo points—and with each match there is an exchange. The winner takes points from the loser. If the victory is by surprise (because the weak team wins) the teams exchange more points. The rankings Elo they work well and they are increasingly used, in sports and video games, for example, to organize games between players of similar level. Our model uses the ranking Website rating Eloratings.
Why we use the value of templates. Because the teams play few competitive matches and that makes it difficult to measure their performance before a big event. One way to add information to the model is to use the transfer market value of the players that make up the team. We take the data from the popular website Transfermarktadjusted for the age of the players (those over thirty are cheaper because they have fewer years of career ahead of them).
How the match simulator works. We have adjusted a simple model that estimates the goals that each team will score based on: 1) if it is better or worse than its rival by Elo points, 2) if it is better by squad value, and 3) if it plays as host, away or in neutral field. The model uses a Poisson distribution, which reasonably approximates goals, and which has been used in statistical models and academic studies.
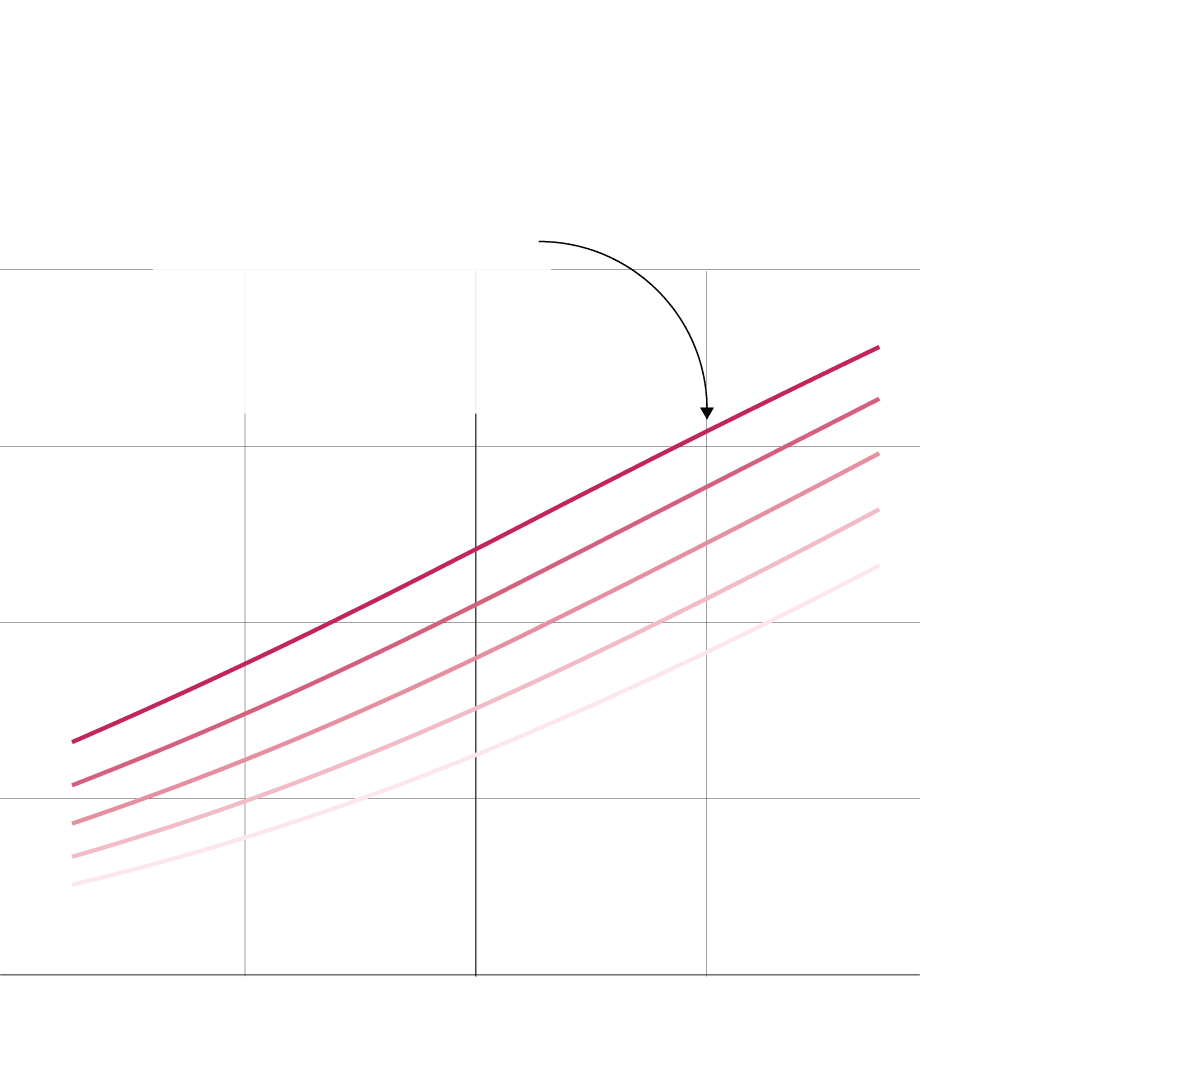
In the end, for our model, for a match on a neutral field, the probability of a team winning a match depends on two numbers: the differences with the rival in Elo points and squad value. The graph sums it up:
Difference of
value of
160 million
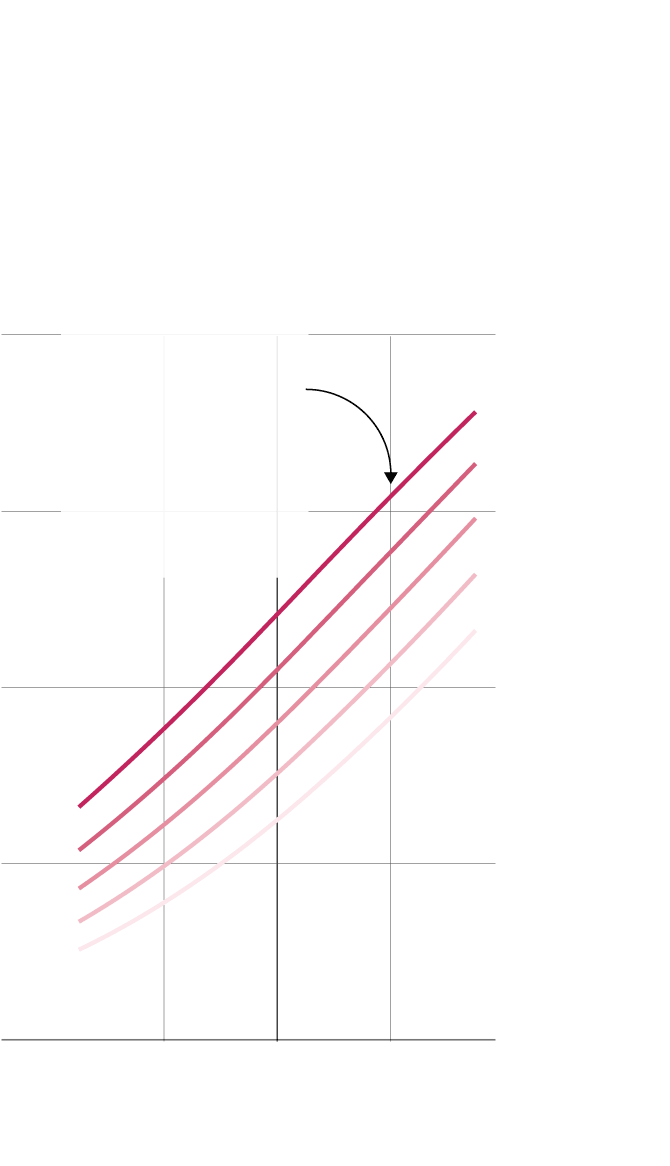
A team with a squad 160 million more expensive than its rival and with 200 more Elo points wins 62% of its duels
Difference of
value of
160 million
A team with a squad 160 million more expensive than its rival and with 200 more Elo points wins 62% of its duels
Difference in value of
160 million
In the Copa América, all matches are considered neutral except those played by the United States, the host. The Americans have a double benefit: we give them the advantage that a team has when playing at home – in a league or World Cup qualifying match, for example – but we also add an extra push equivalent to 0.2 goals per game. game. We have chosen that number based on an analysis by FiveThirtyEight, which has estimated the organizer’s historical advantage in a World Cup at 0.4 goals per game over what was expected.
Why do we use a model that predicts goals and not directly wins? There are two advantages to doing it this way: it helps us to resolve the group stage and to predict overtime (such as 30-minute matches). Some studies Dixon & Coles, 1997 They say that models that predict goals underestimate ties. We have verified that this is the case in the Champions League, and in the major European leagues, but the effect is less in the World Cups, and we have decided not to make that adjustment with the Copa América.
What success can we expect from the model. To calibrate it, we have used a database of 18,000 national team matches since 2004, including hundreds of matches from World Cups, Euro Cups and Copa América.
With training data, the model correctly predicts the result of 60% of the matches with the local team and 56% on a neutral field. Evaluated in probabilistic terms, the model predictions obtain a score between 0.176 and 0.186 (expressed with a Probability Score Rankingas explained here either here. A reasonable precision, if we compare it with other models or with bets.
You can also see the evaluation we made of our 2018 model and in 2022, after each World Cup.

